Identify your use case

  • Our in house developed framework using global best practices

  • Our unique offerring in consulting

  • From acquisition to growth to retention - What should your brand do?

  • Item description

Choose your use case and lets start collaborating

Paper cutout of five human figures holding hands, arranged in a pyramid shape, with the text "The Influence Pyramid" to the left.
Graph titled 'IMPACT: Brand's chance to Hero' showing a curve with labeled stages: Status quo, Opportunity/challenge, Resolution, Infection point.
A blue jigsaw puzzle with one piece removed, revealing a yellow background behind the missing pieces.

SELLING YOUR IDEA/PRODUCT OR SERVICE

B2B sales is an art.

Its not about a transaction

Its not about solving their problems

Its about solving their Customer’s problem

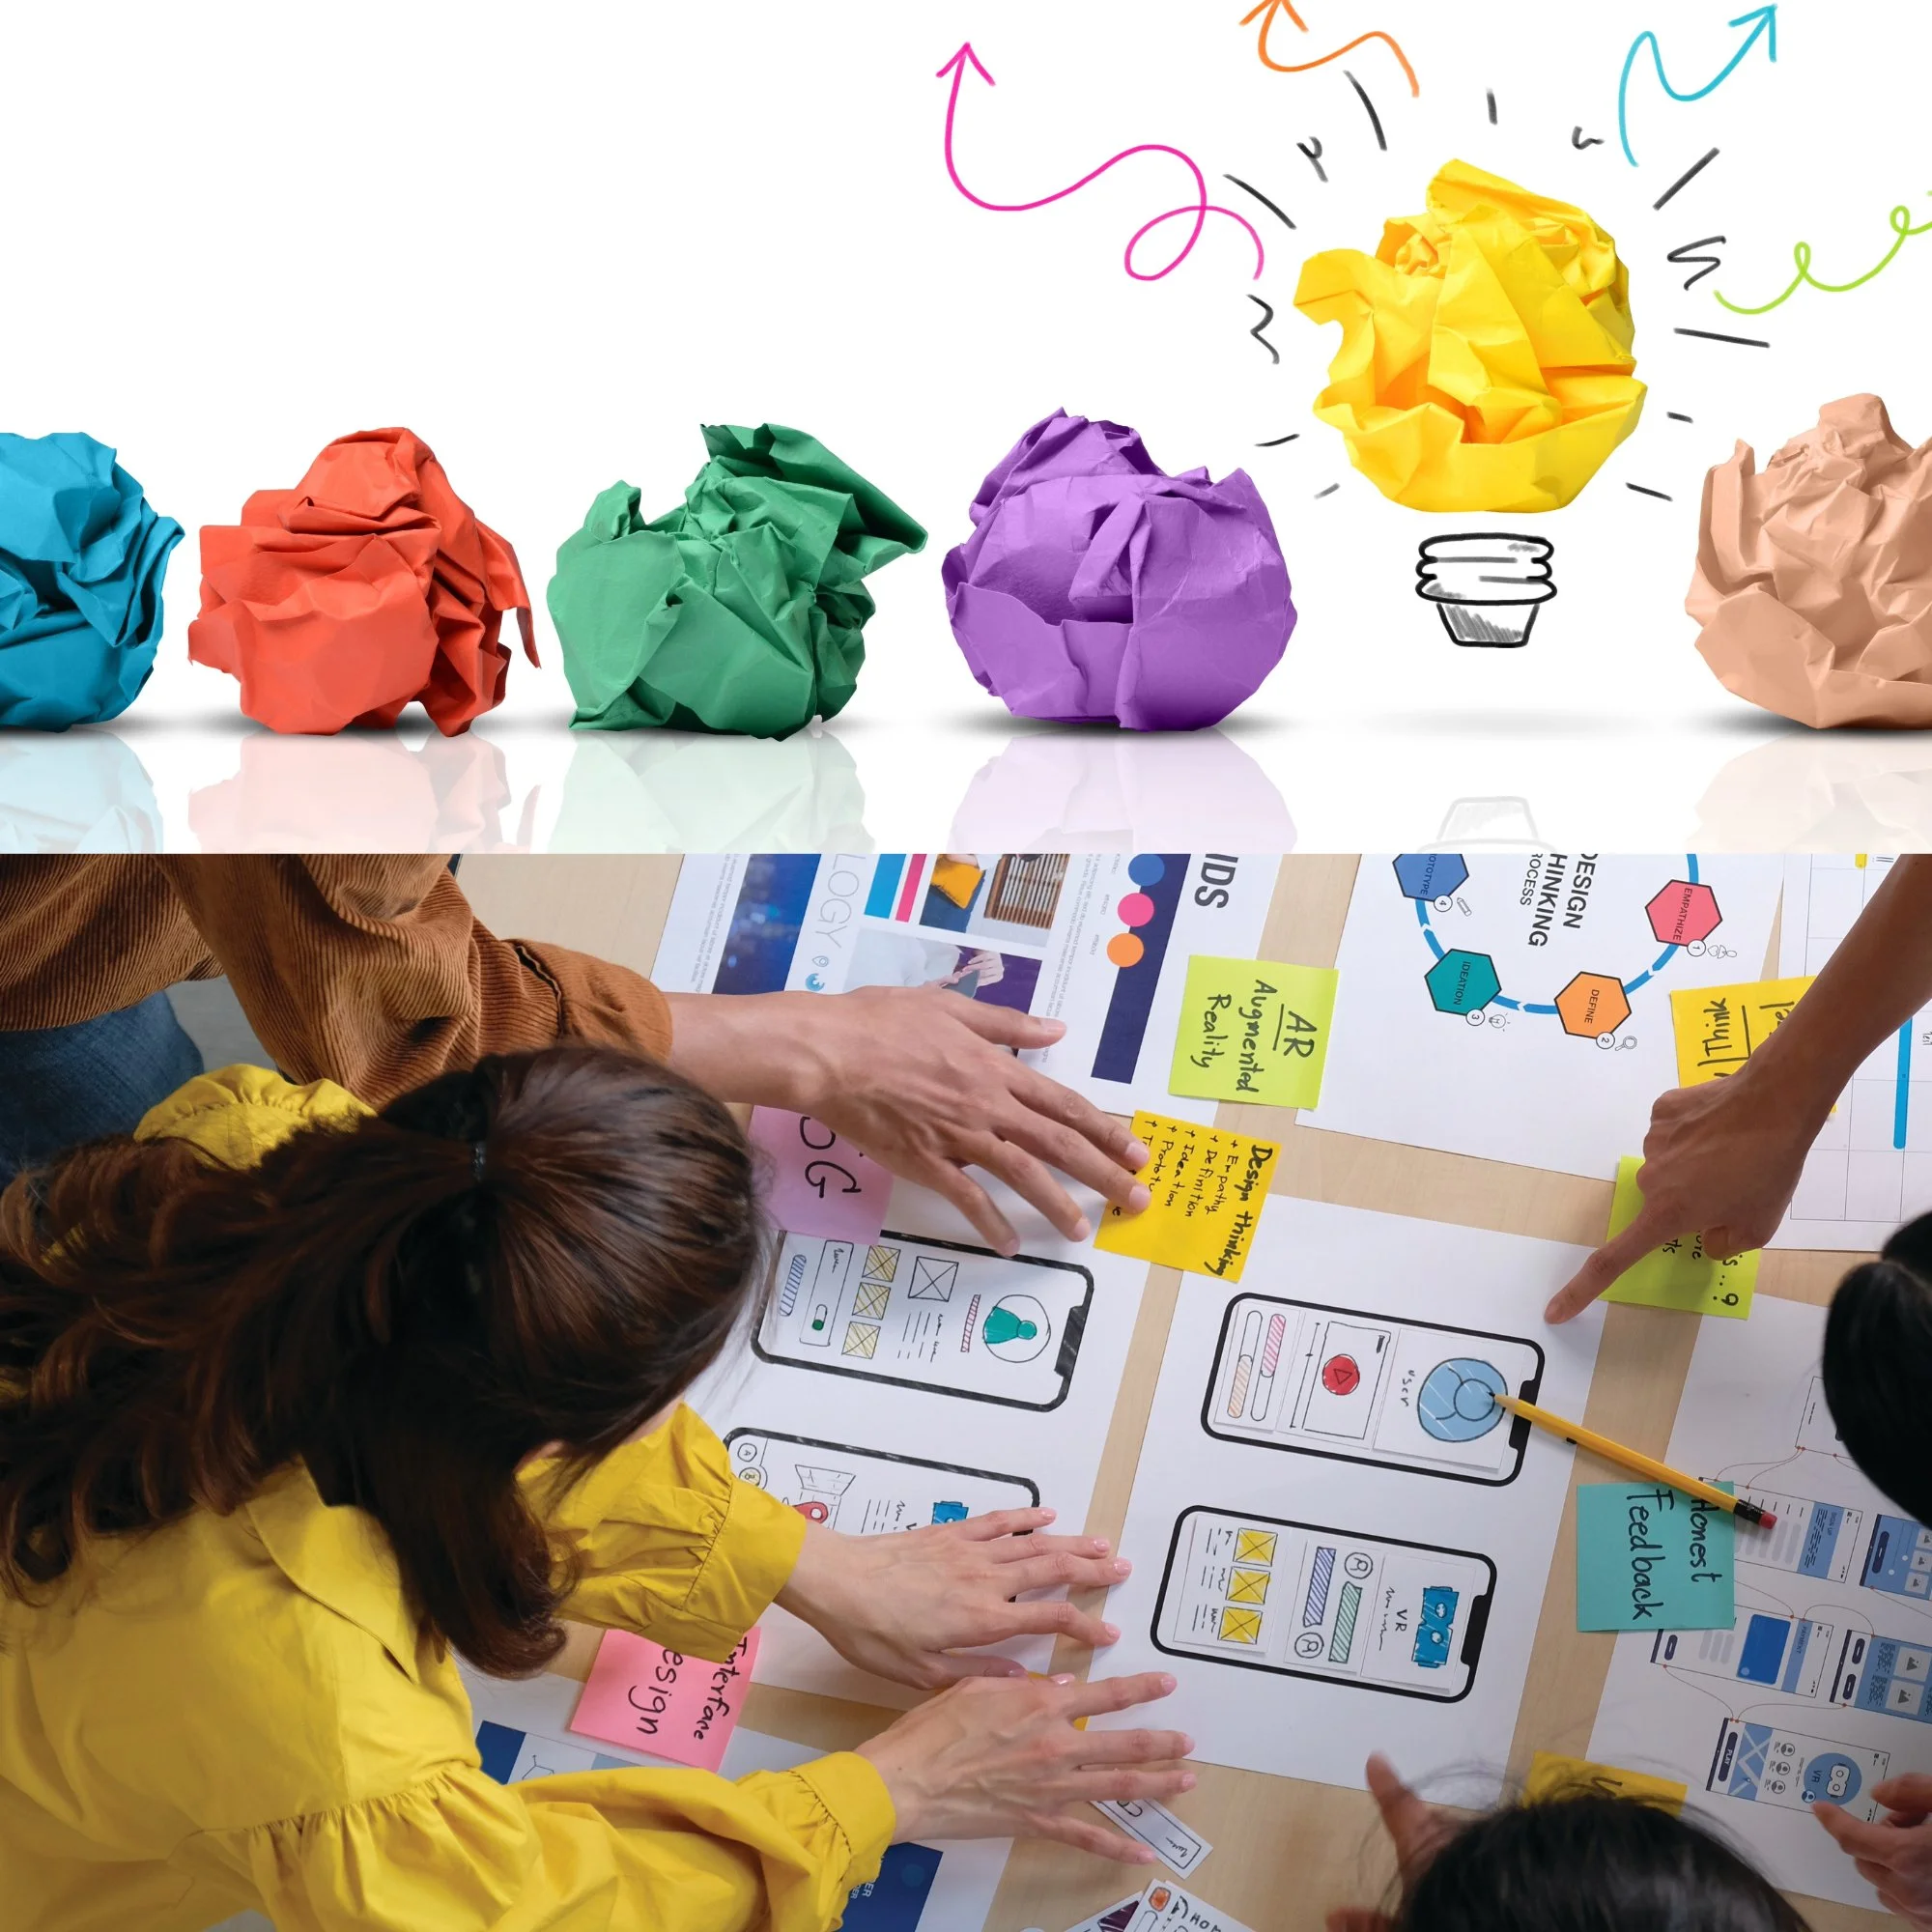
CRAFTING YOUR BRAND STORY

Your brand story is more than a product description

It’s about why people should buy from you and not what it is

Becoming a Customer Artist

How well do you know the consumer’s problem?

What should you be designing?

So it sells..

Your challenge not listed above ? Choose from below or just fill in the form with your unique problem

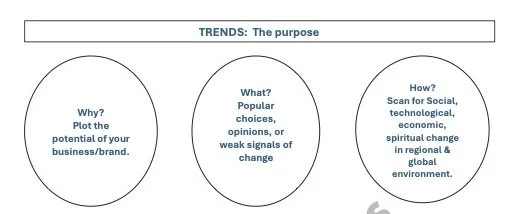
Lets get trending for your brand

A diagram titled 'TRENDS: The purpose' with three circles labeled 'Why?', 'What?', and 'How?'. The 'Why?' circle mentions plotting potential business or brand, the 'What?' circle refers to popular choices, opinions, and weak signals of change, and the 'How?' circle discusses scanning for social, technological, economic, spiritual change in regional and global environments.
Tell us your challenge now

Are you collecting all the data that there is to collect?

Flowchart titled 'Data Collection Ladder' with steps numbered 5 to 8, describing stages in data collection from current customer experience to business analysis and jobs to be done.

What can be the disruption and innovation in your category?

Infographic illustrating consumer attitudes towards sustainable products, showing three types of attitudes: cognition, conative action, and affective feelings and emotions, with descriptions of each. The infographic also includes diagrams about disruption, innovation, and management coming together, with various labels and text explaining business models and transition zones.

Lets break down target segments for your product !

Collage of diverse groups of people enjoying various activities, including walking on the beach, using technology, shopping, and biking, with a focus on consumer opportunities for the TATA group.
Diagram of a triangle with the center labeled 'Tri-component attitude.' The three sides labeled 'Behavioral factors (Actions),' 'Affective factors (Feelings),' and 'Cognitive factors (Thoughts).'

Scope and methods for each of select services

Consumer Needs Assessment

  • A complete, exhaustive collation of the Consumer. We answer the 5 W’s. We follow the playbook in the Consumer Needs Assessment—as a sample of the output.

  • 8-10 weeks

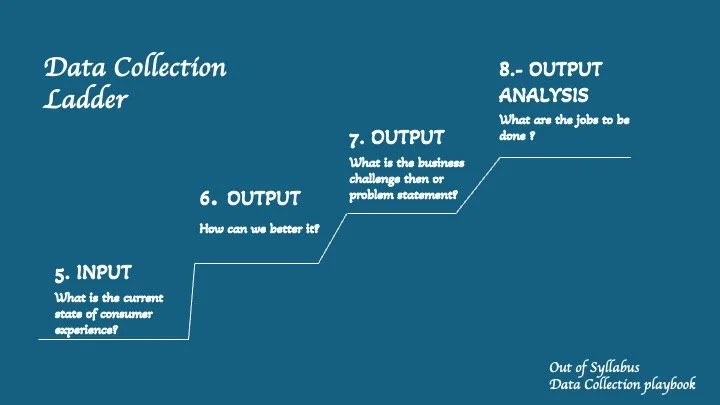
    Data generation to analysis

    From Record to Conclusions

    Customer Journey Jobs to be done across the stages

Foresight Insight logo with a central image of a light bulb emerging from clouds, symbolizing ideas and innovation.

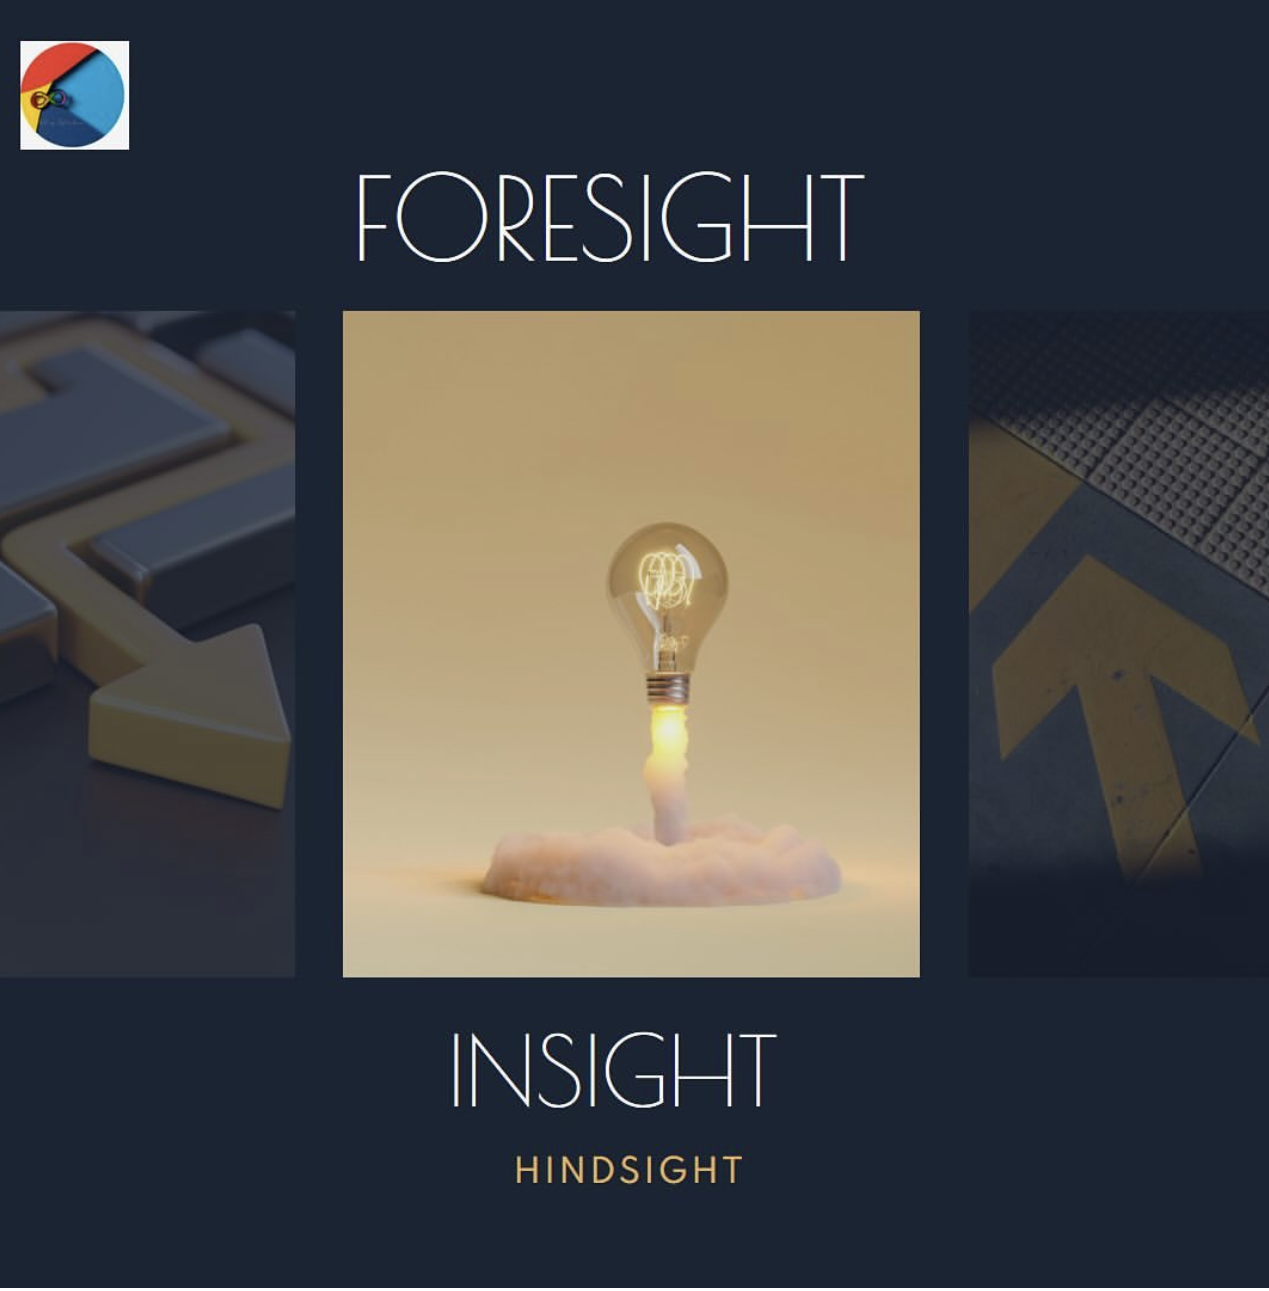
Futures and Foresight

  • Starting with trends, moving through consumer demand and supply forces, and finishing with frameworks that help deconstruct the critical factor.

    Step by step, we craft scenarios that enable companies to mitigate risk,push a narrative and plan for the future.

  • 6-8 Weeks Possible,Potential,Preferable, Scenarios

A row of crumpled colored paper balls with a drawing of a light bulb and arrows above them, and a group of people working on a design project with sticky notes, printed diagrams, and sketches on a table.

Consumer &

Brand strategy

  • Positioning, USP’s for the brand & their pillars

    Narratives & their play.