We're deliberately small. And I spend a lot of time on understanding what will work for your brand- Almost like a Blood test report to know what to work on.
Most projects are taken on by a team of two or three, in close collaboration with our clients. We don't pitch, we don't subcontract, and we don't take on more than six projects a year.
Passionate Advocate of frameworks. Almost to a cult level.
It can be the behind the scenes work- Or
co-created - depends upon you.

Scope and methods for each of select services
Consumer Needs Assessment
-
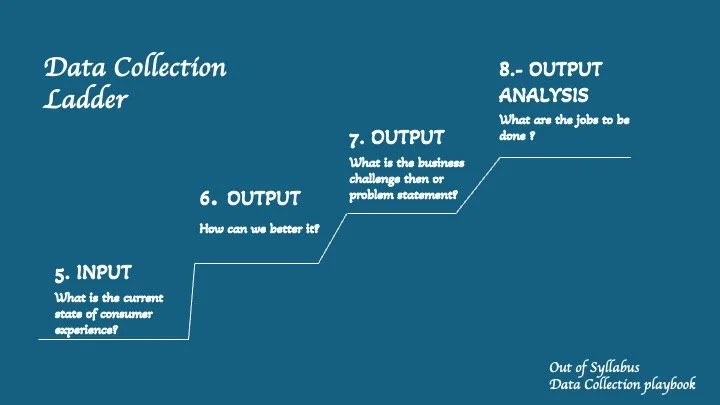
A complete, exhaustive collation of the Consumer. We answer the 5 W’s. We follow the playbook in the Consumer Needs Assessment—as a sample of the output.
-
8-10 weeks
Data generation to analysis
From Record to Conclusions
Customer Journey Jobs to be done across the stages
Futures and Foresight
-
Starting with trends, moving through consumer demand and supply forces, and finishing with frameworks that help deconstruct the critical factor.
Step by step, we craft scenarios that enable companies to mitigate risk,push a narrative and plan for the future.
-
6-8 Weeks Possible,Potential,Preferable, Scenarios
Consumer &
Brand strategy
-
Positioning, USP’s for the brand & their pillars
Narratives & their play.


Branding b2b business.
You have the business opportunity.
we craft the EMOTION to make you the chosen solution.
CRAFTING YOUR BRAND STORY
Your brand story is more than a product description
It’s about why people should buy from you and not what it is
Lets get trending for your brand
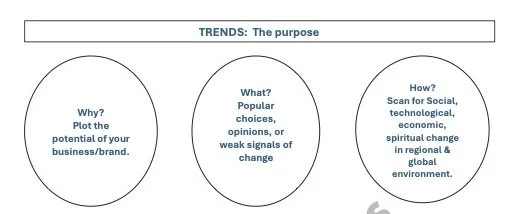
Are you collecting all the data that there is to collect?
What can be the disruption and innovation in your category?

Lets break down target segments for your product !